|
|
 |
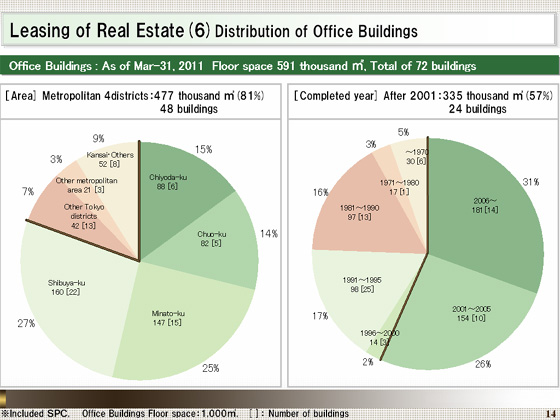
These charts show our office building portfolio.
Total floor space of our office buildings as of March 31, 2011, stood at 591,000 square meters, of which 81% is concentrated on the four central metropolitan wards of Chiyoda, Chuo, Minato, and Shibuya, at 477,000 square meters.
A total of 57% of all office buildings were completed during or after 2001.
We believe that our office buildings are relatively resistant to the worsening market situation and their rents will quickly recover when the market begins improving, because these buildings are mostly concentrated in central Tokyo, and many are relatively new. |
|
|
